Upload file
File detail
Notes: The table only displays the information of the first 10 rows and 10 columns of the upload data
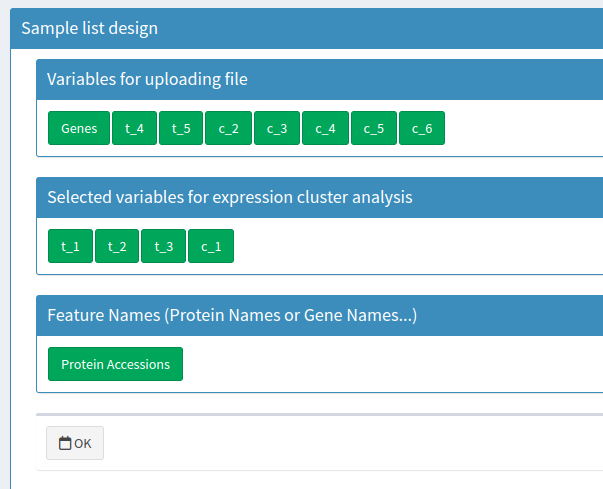
Sample list design
Designed sample list
Mfuzz analysis parameters
Minimum SD
Number of clustered
Perform analysis
Table output
Plot output
Plot parameters
Mfuzz plot
Cluster Analysis of Expression Patterns
Application scenario:
Clustering is an important tool in gene expression data analysis - whether at the transcriptomic or proteomic level, this unsupervised classification technique is often used to reveal the structure hidden in large gene expression datasets. Most clustering algorithms partition the data into hard clusters, where each gene or protein is precisely assigned to a cluster. Hard clustering is advantageous if cluster separation is good, but gene or protein expression data is often not in this scenario as gene or protein clusters frequently overlap. Additionally, hard clustering algorithms are typically very sensitive to noise. To overcome the limitations of hard clustering, we have implemented soft clustering, which has stronger noise robustness and avoids prior filtering of genes or proteins, which can prevent the exclusion of biologically relevant genes or proteins from data analysis.
Analysis methods:
We used the Mfuzz method to perform clustering analysis on protein expression under different continuous samples (such as different treatment times or drug concentrations). This method utilizes a new clustering algorithm called fuzzy c-means algorithm, which reduces the interference of noise on the clustering results to a certain extent compared to hard clustering algorithms such as K-means. Moreover, this algorithm effectively defines the relationship between proteins and clusters.
Results presentation:
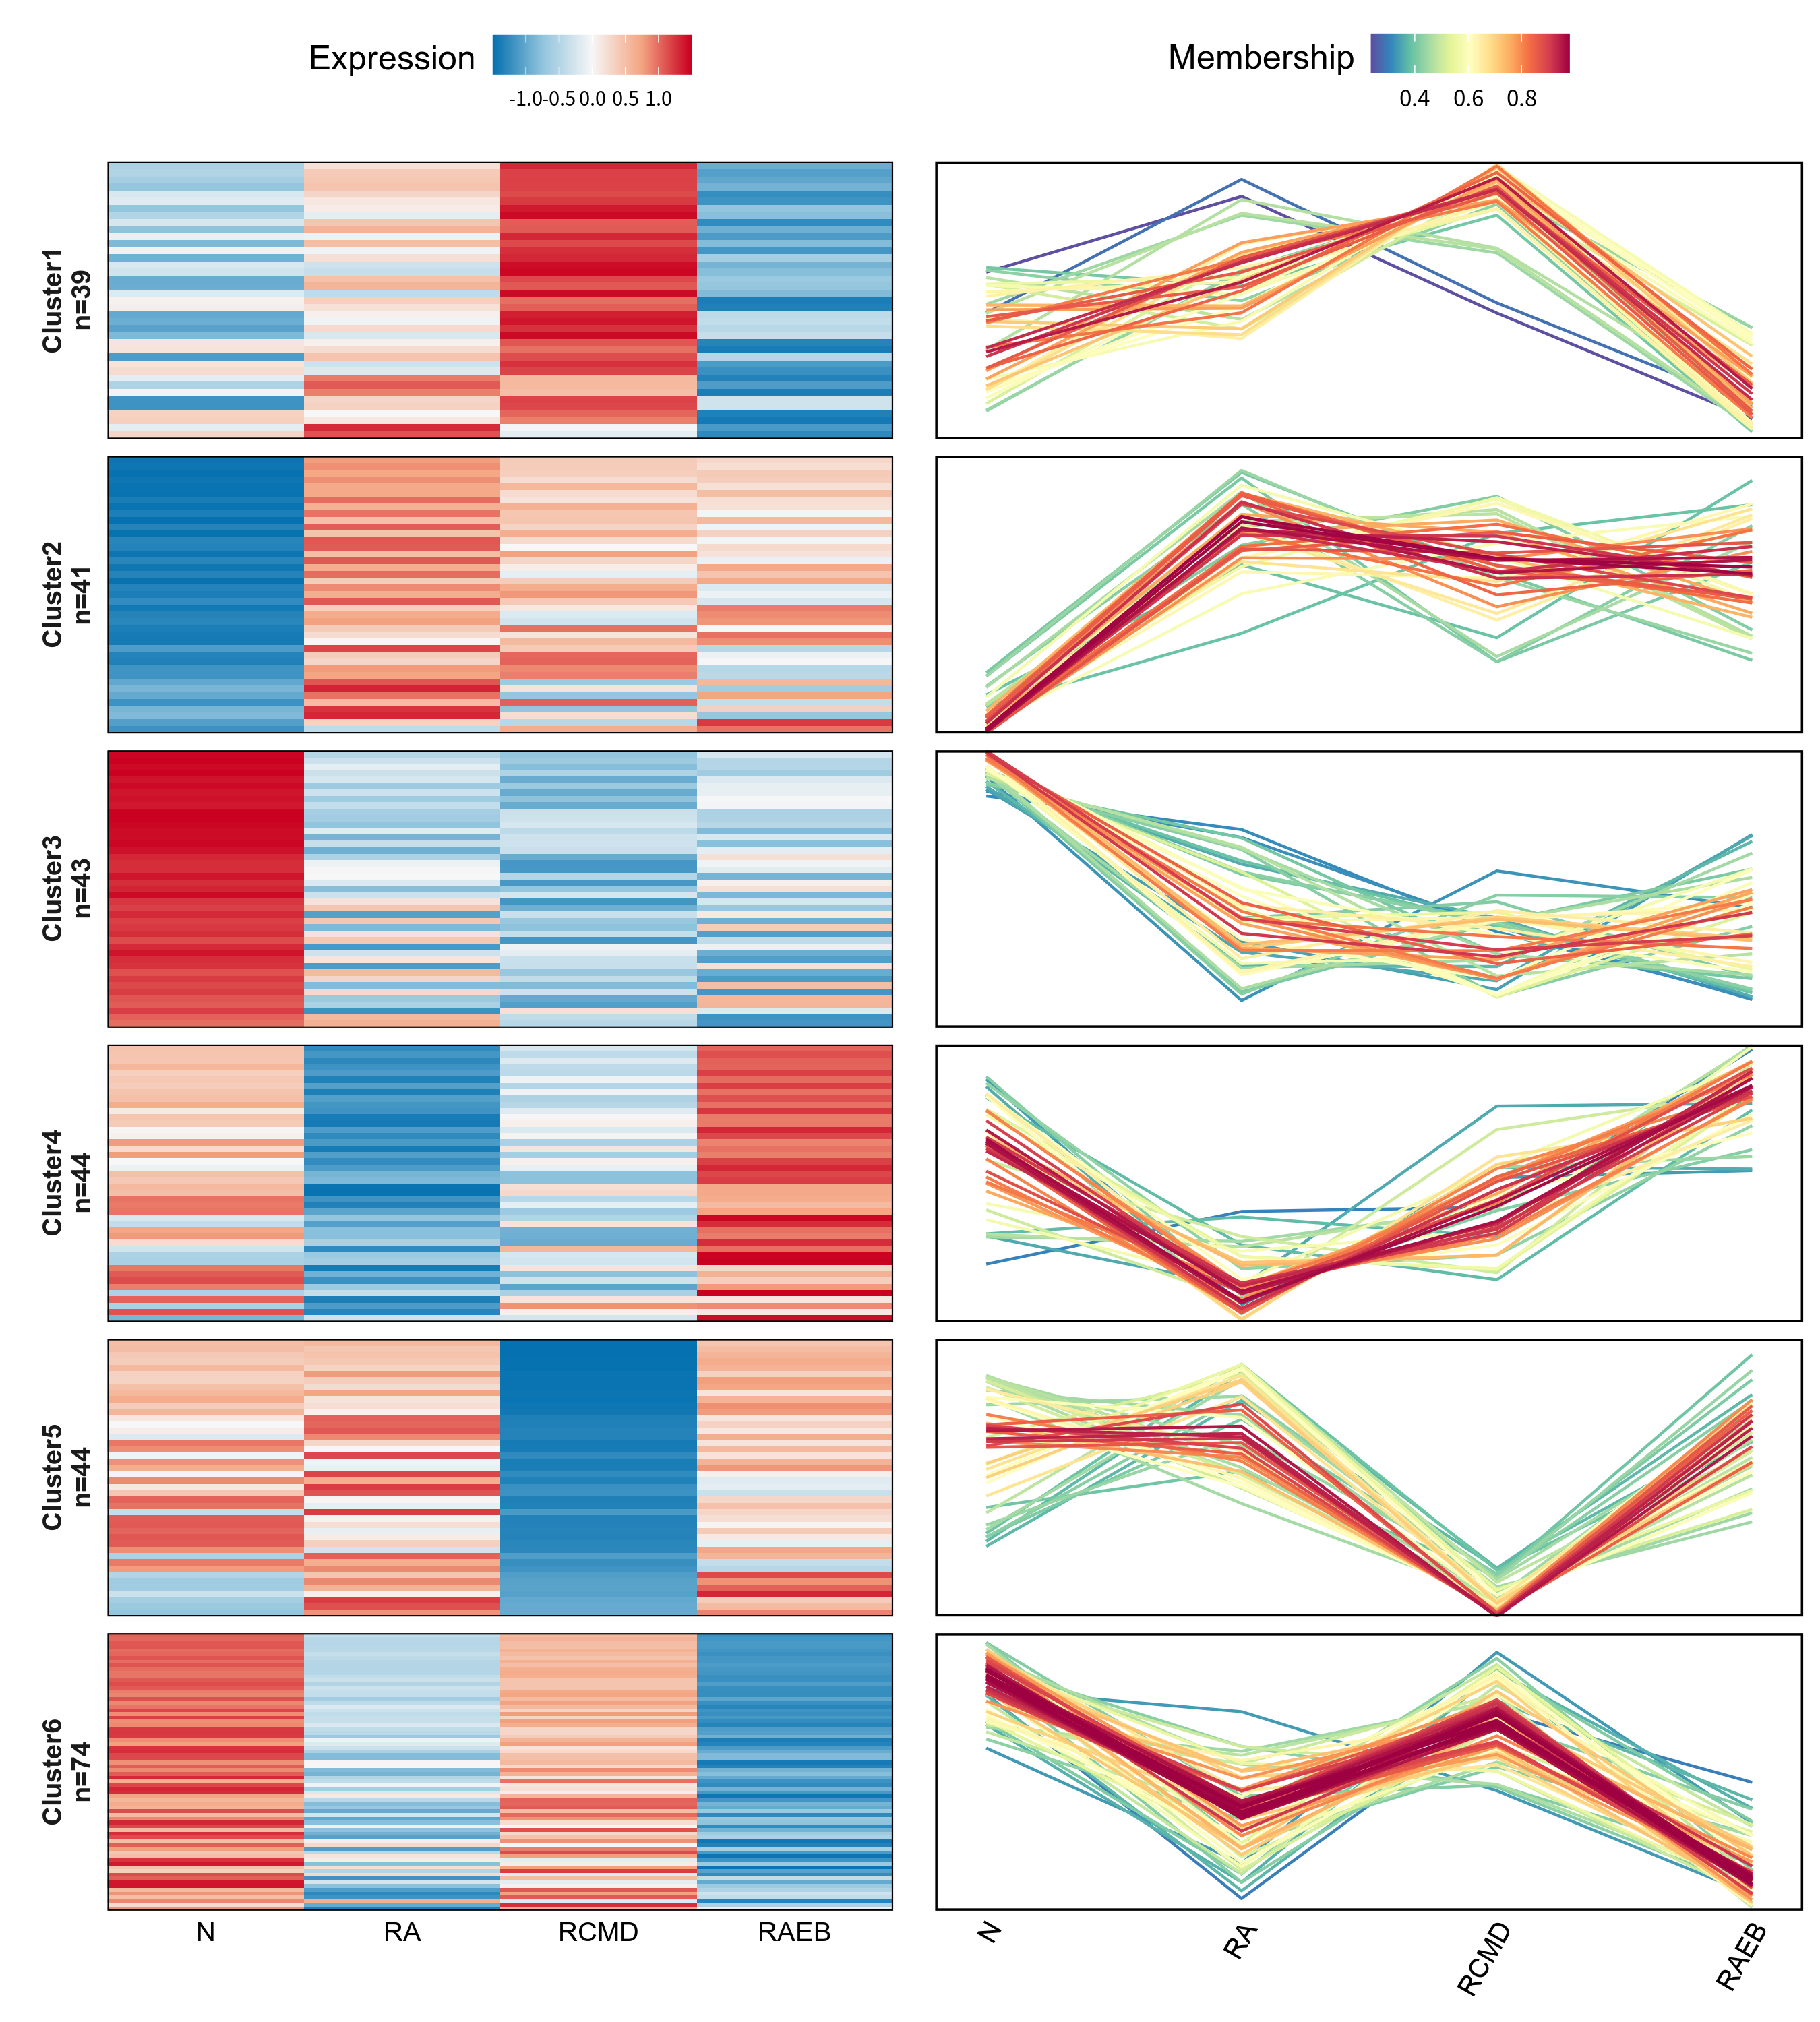
Note: The clustering analysis results of the expression patterns of continuous samples are shown in the figure. The left side of the figure intuitively shows the trend of protein expression changes in continuous samples in the form of a line chart. The horizontal axis represents continuous samples; the vertical axis represents protein expression level; and each line represents a protein. Based on the different trends of the lines, they are clustered into 6 different clusters. Heat maps of the expression levels were drawn for each set of proteins with different trend clusters.
Input file format requirements:
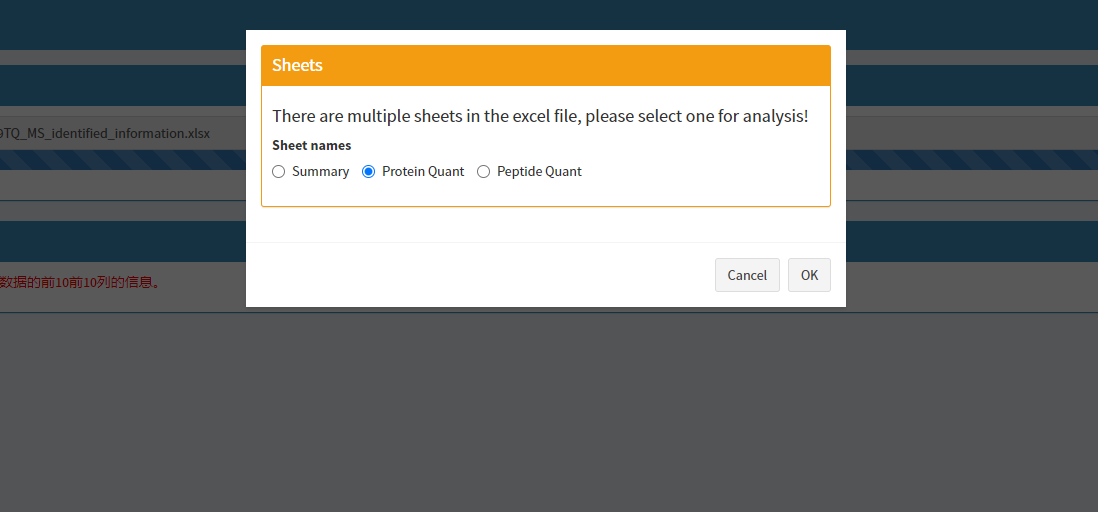
The input file format supports three formats: tab-separated txt, csv, and Excel files. If the input file is in Excel format and contains multiple sheets, you will be prompted to select one of the sheets as the input data after the upload is complete.
Input file requirements:
The 'Feature Names' column should include unique identifiers for proteins or genes, paying attention to case and spaces. Subsequent columns can contain additional information, which does not impact the analysis. The column names, representing sample identifiers for expression levels, must start with a letter and can include letters, numbers, '_', and '.'.
The protein expression column must be a number greater than 0 and cannot be 0. Null values are allowed, and 0 can be replaced with a null value. During data processing, the quantitative values are first converted to logarithmic values using the Log2 transformation.
The data example is shown as follows: (where t_1, t_2, t_3, t_4, t_5 columns are the protein expression values in the samples)